Glucose metabolism not only provides the energy for physiological functioning of organs, but also sustains cellular homeostasis and growth in animals and humans. Imaging glucose uptake and metabolism is significant for monitoring physiology and pathology of organs, as well as the development and treatment of cancers. A variety of techniques have been developed for imaging glucose metabolism, such as 18F-FDG (fluorodeoxyglucose) positron emission tomography (PET) (1), 13C magnetic resonance spectroscopy and spectroscopic imaging (2), mass spectrometry (3), and optical imaging methods such as fluorescence (4).
However, these existing methods can only visualize the early stages of glucose metabolism (catabolism), but cannot monitor the process from glucose anabolism to macromolecule synthesis in situ. Hence, we are developing for new techniques that can image the full picture of glucose metabolism, which would allow us for monitoring the functional status of cell, tissues and organs in situ.
Our group has developed a series of techniques based on isotopes/alkynes tags of stimulated Raman spectroscopy for imaging metabolism in cell culture. Here, Raman spectroscopy is a technique that probes molecules’ vibration by their inelastic scattering, and provides molecular fingerprints in a specimen, such as the concentration and composition of chemical bonds. There is an increasing concern of heterogeneous cell types in mammalian tissues, so is metabolic dynamics, which motivated us to develop techniques for imaging in animals.
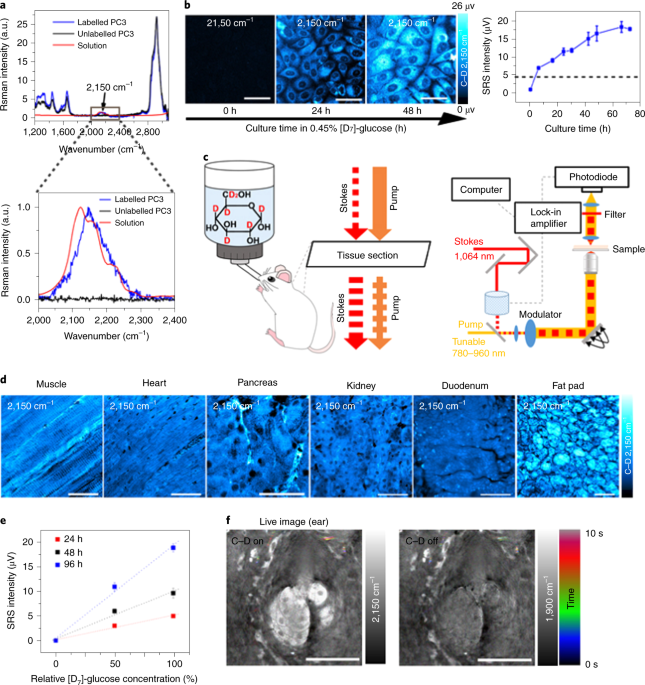
Recently, by combining heavy water (D2O) probing and SRS (DO-SRS) microscopy, we successfully visualized metabolic dynamics in living cells and animals. As a non-carbon source metabolite, D2O can equilibrate rapidly with body water in cells and label biomolecules with deuterium (D) by forming carbon–deuterium (C–D) bonds in newly synthesized macromolecules, such as proteins, lipids, and DNA. More importantly, we discovered Raman spectral difference among these different types of molecules; using Raman spectra of C-D bonds we could distinguish newly formed protein, lipids and DNA.
The success of the DO-SRS imaging technique inspired us: what if administrating deuterium-labeled glucose ([D]-glucose) into cells or animals, will we observe glucose metabolism? We hypothesized that the already existing C-D bonds in [D]-glucose would be carried over into newly synthesized macromolecules. Using SRS we would be able to track the Raman spectra of C-D bonds in protein and lipids, and using linear algebra we would separate these signals to spectrally unmix the components. This led to the development of our new technique, Spectral TRacing of DEuterium isotope (STRIDE) microscopy.
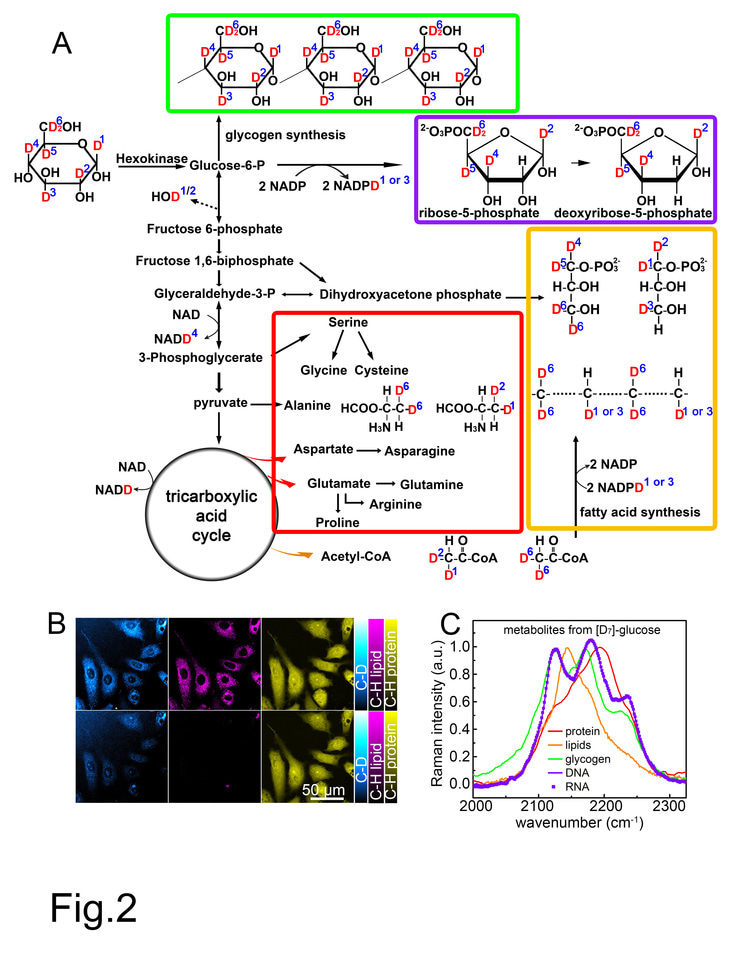
We first validated our STRIDE technique by SRS imaging of cells cultured in [D7]-glucose (a glucose isotopologue) and mice administrated with [D7]-glucose in drinking water in vivo. Both experiments demonstrated distinct Raman peaks of C-D bonds, which distinguished various types of glucose-derived macromolecules (lipids, protein, DNA, RNA, and carbohydrates).
Then we explored the applications of STRIDE with SRS imaging. With multi-channel SRS imaging in both cell culture and mice drinking [D7]-glucose water, newly-synthesized macromolecules such as lipids, proteins, DNA, and glycogen could be individually visualized and separated due to their distinct Raman spectra of C-D bonds (Fig. 1). In addition, the syntheses of those macromolecules in cells and mouse could also be quantified using STRIDE, indicating differential utilization of glucose metabolism. Further, we used STRIDE imaging and successfully detected metabolic dynamics of macromolecules in a variety of mouse organs, including the brain during development and xenograft tumor progression, adipose, intestine, and liver.
We realized how powerful the spectral information is after conducting the above experiments using [D7]-glucose, we were thinking that [D7]-glucose is a fully deuterated glucose, while there are some other partially [D]-labeled glucose isotopologues that begins with a different spectrum, can we use different glucose isotopologues too in STRIDE for pulse-chase labeling? Pulse-chase is a classic approach to analyze the temporal progression of biological processes by labeling different time intervals using probes with distinct colors. Thus, using [D7]-glucose and [D2]-glucose we developed a two-color pulse-chase imaging technique based on STRIDE. We visualized spatial and temporal distribution of biosynthetic activities of glycogen synthesized in different time windows in mouse liver tissue, as well as lipids synthesis in sebaceous glands.
Our study has demonstrated the broad applications of STRIDE. Evidently, STRIDE offers a high spatial resolution in a noninvasive way to map tissue metabolic heterogeneity. We envision the broad applications of STRIDE in in vivo imaging in the near future with the rapid advance of instrumentation, such as epi-detected SRS and coherent Raman scattering endoscope.

Figure 1. Left: Normalized C-D Raman spectra of four glucose-derived macromolecule metabolites, indulging glycogen from [D7]-glucose-fed mouse liver (fasted overnight and acutely stimulated and labeled by 10% [D7]-glucose for 8h), and proteins, lipids and nucleic acids (including DNA and RNA) extracted from Hela cell cultured with 0.45% [D7]-glucose for 6 days. Top right: Images of a [D7]-glucose-labeled mitotic HeLa cell’s newly synthesized C-D labeled DNA (CDD), lipids (CDL), and proteins (CDP). Bottom right: Images of a [D7]-glucose-fed mouse liver’s newly synthesized C-D labeled lipids (CDL), glycogen (CDG), and proteins (CDP).
Our paper: Spectral tracing of deuterium for imaging glucose metabolism Luyuan Zhang, Lingyan Shi, Yihui Shen, Yupeng Miao, Mian Wei, Naixin Qian, Yinong Liu & Wei Min. Nature Biomedical Engineering (2019)
(1) Gambhir, S. S. Molecular Imaging of Cancer with Positron Emission Tomography. Nat Rev Cancer 2002, 2 (9), 683–693.
(2) Rodrigues, T. B.; Serrao, E. M.; Kennedy, B. W. C.; Hu, D.-E.; Kettunen, M. I.; Brindle, K. M. Magnetic Resonance Imaging of Tumor Glycolysis Using Hyperpolarized 13C-Labeled Glucose. Nat. Med. 2013, 20 (1), 93–97.
(3) Sugiura, Y.; Katsumata, Y.; Sano, M.; Honda, K.; Kajimura, M.; Fukuda, K.; Suematsu, M. Visualization of in Vivo Metabolic Flows Reveals Accelerated Utilization of Glucose and Lactate in Penumbra of Ischemic Heart. Sci. Rep. 2016, 6.
(4) Hu, F.; Chen, Z.; Zhang, L.; Shen, Y.; Wei, L.; Min, W. Vibrational Imaging of Glucose Uptake Activity in Live Cells and Tissues by Stimulated Raman Scattering. Angew. Chemie - Int. Ed. 2015, 54 (34), 9821–9825.


Please sign in or register for FREE
If you are a registered user on Research Communities by Springer Nature, please sign in